The Effect of Spinning on Sweat Rate
Posted on December 18th, 2011 by Andries Lodder
While studying Exercise Physiology at Wits, we did this research project. I thought I’d share it with you all.

Abstract
Aim.
The purpose of this study was to investigate what effects spinning have on sweat rate under certain environmental conditions and to investigate what other variables contribute to sweat rate changes.
Methods.
Sixteen healthy regular spinners took part in a 45-minute spinning class on three separate days. Pre and post nude body weight, amount of water consumed, heart rate and ratings of perceived exertion (RPE), dry- (TDB) and wet-bulb temperatures (TWB) and were measured throughout the duration of the spinning class.
Results.
A linear relationship between sweat rate and RPE and weight loss were correlated. Therefore an increase in RPE caused an increase in sweat rate, which lead to an increase in body weight loss post spinning (R2 = 0.3569; R2 = 0.3693; respectively; p < 0.05). No significant difference was observed for TDB, TWBand relative humidity between each of the three days (p = 0.3532; p = 0.4933; and p = 0.4580; respectively; p > 0.05).
Conclusion.
During a high intensity spinning class, the greater the RPE, the higher the sweat rate, and the greater the post spinning body weight loss. Additional studies need to be done under different ambient conditions, to determine whether a change in those conditions would have an effect on sweat rate.
Keywords:
sweat rate; spinning class; fluid replacement
Aim
Spinning has hit the world by storm. More and more people, including cyclist, take part in spinning classes due to everyday lives getting busier and national roads more dangerous to cycle on, leaving less time for exercise in the outdoors. Spinning, being an indoor event in a controlled environment, simulate a high intensity training session, but being indoors, the effects on and of the human body will be different than it would be outdoors. Therefore the question arose of what effects occur on the body during a spinning class, what effect does it have on sweat rate under certain environmental conditions, and therefore to investigate what other variables contribute to sweat rate changes.
Materials and Methods
Subjects
Sixteen (3 males and 13 females) healthy regular spinners, aged 31 ± 10 years (mean ± SD) and mass 67.2 ± 10.5 kg, volunteered to participate in this study. The experimental protocol was approved by the University of the Witwatersrand Committee for Research on Human Subjects (M020804) and all subjects gave written consent before participation.
Experimental procedure
Volunteers were recruited from Planet Fitness Spinning Studio, Wanderers, Johannesburg. The same instructor conducted all three spinning classes at similar intensities on three separate days at 5pm during the month of October 2006, in an enclosed air-conditioned environment. Before the start of the spinning class they completed a questionnaire that assessed spinning history, fitness levels and daily hydration and health status.
Before and after each class, nude body weight was measured using an electronic scale (SECA Alpha scale, Model 770, Germany). The spinners were asked to empty their bladders before measuring their pre-spinning weight and to towel off any excess sweat before measuring their post-spinning weight. The amount of water they consumed during the class was determined by measuring the amount of water in their bottles before the class, and the amount remaining at the end of the spinning class.
All participants wore Polar Heart Rate Monitors (FS3C model; Polar Electro, Kempele, Finland) for the duration of the class. Heart rate (HR) was recorded every 5 minutes from the start of the spinning class. Rate of perceived exertion (RPE), an indicator of how hard they felt they were working, was determined every 5 minutes using the 10-point Borg Rating scale (Borg, 1970).
Dry-bulb temperature (TDB) and wet-bulb temperature (TWB) were measured every 10 minutes using a Whirling Psychrometer (Haden, England). Relative humidity was calculated using a psychrometric chart.
Statistical analysis
Data are shown as mean ± standard deviation unless otherwise stated. A Spearman’s correlation was used to determine the relationship between RPE and sweat rate and amount drunk. A Pearson’s correlation was used to determine the relationship between sweat rate and percentage of heart rate maximum, heart rate maximum, weight loss, amount drunk and average heart rate, as well as between average heart rate and amount drunk. A paired t-test was used to analyze for differences in body weight before and after the spinning classes. A one-way ANOVA test was used to determine the relationship between TDB, TWB and relative humidity. All statistical analysis was performed using GraphPad InStat version 3.00 for Windows 95, GraphPad Software, San Diego. California USA. Statistical significance was set at P< 0.05.
Results
Subject characteristics, significant results, physiological responses and ambient environmental conditions during the spinning class of the 16 spinners are represented in Table 1 below.
Table 1 – Table showing weight fluctuations, water consumption, and sweat rate during a spin class in the 16 spinners, as well as the ambient environmental conditions (mean and SD).
| Age (yrs) | Body Weight before (kg) | Body Weight after (kg) | Body Weight loss (kg) | Amount drunk (l) | Sweat rate (l/hr) | TDB* (°C) | TWB** (°C) | Relative Humidity (%) | |
| Mean | 31 | 65.3 | 64.7 | 0.4 | 0.405 | 1.1 | 20.1 | 14.6 | 57.7 |
| SD | 10 | 10.5 | 10.6 | 0.3 | 0.263 | 0.3 | 0.6 | 0.2 | 2.5 |
| *TDB: Mean Dry-bulb temperature for 3 the days | |||||||||
| *TWB: Mean Wet-bulb temperature for the 3 days |
Body Weight
We observed a decrease in overall body mass (0.4 ± 0.3 kg) for all participants, which were only statistically significant, but not biologically significant (p = 0.0003; r = 0.9996; 95% confidence interval of the difference: 0.2083 – 0.5542, respectively).
RPE
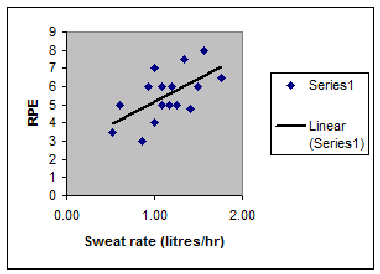
We observed a significant relationship between RPE and sweat rate (y = 2.4759x + 2.692; R2= 0.3569; p 0.05).

Figure 1 – Linear relationship between RPE and sweat rate (litres/hr)
Sweat Rate
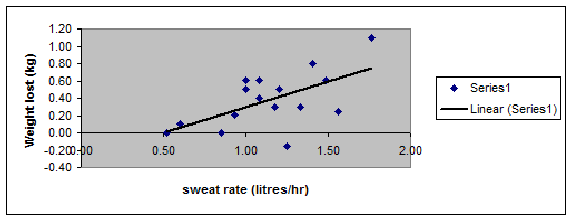
We found a significant relationship between sweat rate (litres/hr) and weight loss (kg) (y = 0.5923x + 0.2942; R2= 0.3693; p 0.05).

Figure 2 – Linear relationship between sweat rate (litres/hr) and weight loss (kg)
Ambient Conditions
We observed no significant difference for TDB, TWB and relative humidity between each of the three days (p = 0.3532, F = 1.136; p = 0.4933, F = 0.7500; and p = 0.4580, F = 0.8339; respectively; p > 0.05). Table 2 below represents the mean and standard deviation differences in TDB, TWBand relative humidity during the three separate days of spinning.
Table 2 – Dry-bulb temperature (TDB), Wet-bulb temperature (TWB) and relative humidity (%) for the three days of spinning| TDB* (°C) | TWB** (°C) | Relative Humidity (%) | |
| Mean ± SD | Mean ± SD | Mean ± SD | |
| Day 1 | 20.4 ± 0.9 | 14.8 ± 0.4 | 57.0 ± 4.5 |
| Day 2 | 19.4 ± 1.1 | 14.4 ± 0.5 | 60.4 ± 7.1 |
| Day 3 | 20.4 ± 1.5 | 14.6 ± 0.5 | 55.6 ± 6.3 |
| *TDB: Dry-bulb temperature | *TWB: Wet-bulb temperature |
Discussion
The aim of this study was to determine the effects of a high intensity spinning class on sweat rate. Therefore to determine how much fluid needs to be consumed to prevent either hyperhydration or hypohydration.
We found that sweat rate has a good linear relationship between RPE as well as weight loss during a 45 minute spinning class. As intensity increases, and therefore an increase in RPE, sweat rate will increase, as well as indirectly have an effect on weight loss.
All these variables (sweat rate, RPE and weight loss) are interrelated.
The effects of a high intensity spinning class are on average a high RPE rating, an increased sweat rate, and a decrease in body weight. During a spinning class, or any physical exercise, hydration is a very important factor contributing towards body temperature regulation, exercise performance and the prevention of the development of heat injury (Convertino et al, 2005).
During the 45 minute spinning class, the difference between the body weight before and after the spinning class, decreased. This could be affected by the amount of fluid consumed or at what intensity the participant was working at. Therefore if the spinner consumes too much fluid (hyperhydration), the smaller the difference in body weight before and after. The same goes for if the spinner consumes too little fluid (hypohydration), the difference between weight before and weight after will be much greater.
An increase in RPE showed a linear correlation to an increase in sweat rate. This was expected, due to the higher the intensity a person works at, the more heat that person is going to produce, therefore to regulate their body temperature and keep it constant, they will increase their sweat rate to eliminate excess heat from the body. No correlation was observed between RPE and amount of water consumed. An increase in RPE will have an effect on thirst, but it is up to the person self to make a conscious decision to consume the water, therefore its very subject specific.
Ambient temperatures for all three days were very similar, no significant differences between the three days. (Mean ± SD; TDB = 20.1 ± 0.6 °C; TWB = 14.6 ± 0.2 °C; and relative humidity = 57.7 ± 2.5 %). These contribute to a controlled environment and increase the validity and reliability of results obtained for these conditions.
Looking at table 1, if you take the means, for a person that weighs approximately 65.3 kg, and drinks only 405 ml water during the 45 minute spinning class, will loose on average 0.4 kg body weight, mostly water, and will have a sweat rate of 1.1 litres/hr.
Conclusion
In the condition of our present study, it has shown that participating in a high intensity spinning class, body weight will be decreased if an insufficient amount of water was consumed. Another important factor that effects body weight loss, is the intensity that a person works at, therefore working at a higher RPE, sweat rate will be increased, and therefore increase body weight loss. These variables all-dependent on the amount of water intake, either hypohydration occurs, which will increase post body weight loss, or hyperhydration, which will decrease post body weight or even increase post spinning body weight. Additional studies need to be done under different ambient conditions, to determine whether a change in those conditions would have an effect on sweat rate.
Reference List
- Borg, G. (1970). Perceived exertion as an indicator of somatic stress. Scand Journal of Rehabilitation Medicine. 2: 92 –98.
Tweet